04 March 2019
Reading time: 5 min
Today we will tell how with the help of statistical process control, feedback and Shewhart control charts our young programmers did something impossible. They were able to reduce the number of bugs visible to the site user by 10,000 times compared with the old version of the portal, which was created by programmers with 5-10 years of experience.
Part 1. Situation and problem
Our task was to write a new version of the portal, which provided information services to the public: ads, chats, news, etc.
What was the main problem?
As we have already mentioned, the old version of this site was created by experienced programmers, but a new version of the project had to be done by students who had no commercial development experience.
Why did this happen?
We try to organize the work of the company so that the result does not depend on the professional level of developers.
We have a special cooperation option. If the customer agrees, programmers with minimal work experience are working on his project. You can say they are baptized in battle.
This kind of cooperation is very beneficial for everyone. Young developers get invaluable experience. The customer receives a good discount and has guarantees that if he does not like the result, he will receive payment back. The company improves the work on real projects by young programmers.
But, of course, on such a project it is important and even critical to ensure quality control and monitoring of everything.
So, in this case, we have developed a large «newborn» system, which was supposed to handle a huge number of requests. And all this had to be controlled. And, obviously, it was simply impossible to avoid mistakes because of inexperienced developers.
Part 2. And what have we done?
From the beginning, our development was based on the principle "If something can break — it will break". Why this principle is much more useful for programmers than the assumption that the program will simply work, you can read soon in our blog.
The question was: "How to make sure that our failures lead to user problems as rarely as possible?".
We will tell you how to solve this problem. In 2012, microservice architecture was not yet very popular. However, we took advantage of this technology.

All requests from the browser were sent to the API in JSON format. The first thing that happened with the request of any service that came into the microsystem was saving it in its original form in the database.
Since this is JSON, it was easy to turn it into a string and, if necessary, restore it. So, we saved all the data that users sent us. And then each request passed through a chain of handlers.
What does it mean? When the request came to the server, there was not a monolithic controller, but a set of handlers. Request processing is a chain where each element, a handler, is responsible for some specific operation.
The middleware functions in Node.JS are an example of such an architecture. Why is this convenient? It is easy to configure handlers without programming.
Another important point: all handlers must be idempotent. Idempotence is the property of certain operations in mathematics and computer science whereby they can be applied multiple times without changing the result beyond the initial application (Thanks, Wiki). Due to the fact that for some data a handler can be called several times, it is important that we always get the same result.
Part 3. Checkpoint
Especially for this site, we created a special service called "Checkpoint", which included two types of handlers. The first "Checkpoint" handler was located at the beginning of each chain, it saved the request in its original form to the database. At the end of each chain of handlers there was another handler from Checkpoint, he informed the service that the request had successfully reached the end and the operation was completed.
If for some time the last "Checkpoint" did not report that the request passed the chain of handlers to the end, we understood that something was wrong with this operation. In this case was started an automatic process, which replayed the whole chain. He took this request as a line, restored it back to JSON and again conducted it through the necessary handlers.
The "Checkpoint" service was written by our developers once and has never changed. Thus, we have a reliable component of our system. What does it mean? He worked for a long time, with no problems with quality, and therefore without changes, which could cause errors.
In contrast, the other handlers in the chain could change and be modified. Because of this, new errors could appear in them.
Thanks to "Checkpoint", if we fixed a bug in some handler, we didn't have to worry about the rest: after some time the system repeated the processing of the request. This avoided more serious problems.
Part 4. How did we use Shewhart control charts?
Wait, now we'll tell. Statistical quality control at the service of programming is more than interesting.
When we created the system described in the previous parts, we automated the collection of statistical data about the work of the site. These data were processed using Shewhart control charts.
What exactly did we measure? The difference between the requests, the processing of which has begun, and those for which it has ended.
We collected this data at a specific time. And then we looked at how many requests started processing and how many finished. As a result, we received a certain number of those requests that were not processed to the end for some reason.
The number was not zero.
In itself, this does not indicate an error. The system works, requests are received constantly. And it is normal that during the operation of the system, some requests have not yet passed their chain of handlers.
The number has always been different.
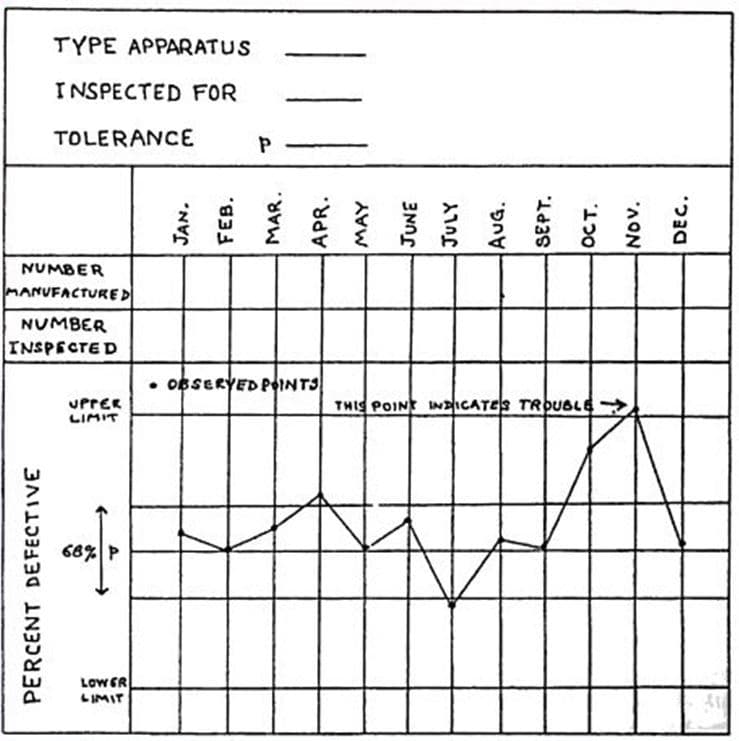
At the same time, we could look for anomalies in the number of requests that started to be executed, but for some reason did not end. To do this, we have determined how many requests in processing is the norm. More precisely, we have defined the lower and upper control border. Values that were located in the corridor between them, we considered the norm. According to the theory formed by Shewhart, crossing of these borders indicates the possible existence of a special reason (in our case, a certain anomaly associated with requests).
Оne day, we found out that for several days the number of messages about non-processed requests grows very quickly. The indicators on the chart constantly go up. This means that all control borders have been passed long ago. The graph has gone beyond all borers; this suggests that there may be a special reason for this.
When we started to search, we really found a mistake. Bug fixed, the developer reported on this. But the problem, especially with inexperienced programmers, is that there may be several reasons for one error.
Part 5. What about errors
Often the error that is fixed actually remains in the code. The programmer can find three causes of this error, but in reality, there may be four, five, ten… And it seems that the bug has been fixed, everything has been checked and it seems that the system is working, but problems may come back again simply because of another reason that no one has found.
For beginners this situation is more difficult: they have no experience, they almost don't know anything about the real system behavior. It's the reason why they often make irrational decisions. The difference between the found and existing causes of errors is what distinguishes the beginner from the experienced programmer.
In this case, methods of detecting changes, including Shewhart control charts, help. They allow you to quickly understand all the causes of bugs were eliminated or not.
Part 6. Result
What did we see after fixing bugs in our system? We found from the Shewhart charts that the number of error messages began to decrease. After some time, the number of error messages in the control points fell below the lower border of our process, calculated earlier. This suggests that our changes significantly improved the characteristics of the system. Thus, the process has changed: it has new characteristics and we have built new control charts based on them.
We realized that with the help of Shewhart control charts we can monitor the state of the system. If an anomaly occurs, we can find out the reasons for this. And also, with the help of control charts, we can understand whether that reasons have been eliminated.
As a result, after three months, the number of errors on the site was reduced by 10,000 times compared to the old version of the system written by experienced programmers (5-10 years of experience). At the same time, when our project started, our young developers had much more mistakes, because they were engaged in such a large-scale project for the first time. Therefore, we can say that progress within our project was much greater.
We equipped all important processes in the system with special sensors, for each Shewhart control chart was built. System was monitored with the help of charts, information was collected once a day.
In case an anomaly appeared, we with a high probability assumed that its appearance was related to the impact on the system in the last 24 hours. During this period, it is very easy to track all changes on the server. That's how we reduced the feedback period between our impact and the system's response to it.
This method has another undeniable plus. Each bug fix was a small, minor change in the system. We did not need to present huge "new versions", which could again lead to serious problems. The number of changes was small and in themselves they were small. Today it is called Continuous Delivery.
We repeat once again: this effect was not achieved in one day. Unfortunately, three months while we were debugging the system, our users suffered. But the result exceeded all expectations.
Part 7. How to automatize the Shewhart charts
To do this we wrote a special library. With the help of this library, we have automatized the collection of statistics and the construction of Shewhart control charts based on it. We created sensors to collect information about the system, at any time these sensors could be inserted into any part of the system without programming. In addition, the library allowed us to visualize these graphs so that we could easily evaluate the result.
Part 8. Summary
First, we should note that the previous version of the system, created by senior programmers, also had a lot of errors. About 7% of the pages did not open at all for this reason. But the problem was not that these programmers were not professionals.
The fact is that they had no feedback. We built feedback on our project and it helped us. Of course, they helped their experience, they made fewer mistakes, but this system was very large, so bugs are slowly but surely accumulated.
Secondly, our young developers were not wizards at all. We started work on the project in a much worse situation than the senior developers, but we had feedback and the ability to detect anomalies, and therefore we saw in which direction we should develop the system.
read more